
Juggling countless calendars and coordination requests can leave even the most seasoned event planner frustrated. For those in North America managing multi-day corporate retreats, choosing the best dates often means sorting through conflicting schedules and endless communications. Embracing scheduling visualization tools offers a smarter way forward by transforming complex availability data into clear, interactive graphics. These solutions help you pinpoint ideal meeting times, spot hidden conflicts, and simplify planning—bringing clarity and control to every stage of your retreat organization.
Table of Contents
- Defining Scheduling Visualization And Its Value
- Variations Of Scheduling Visualization Tools
- How Visualization Streamlines Multi-Day Planning
- Key Features Of Inverse Vs. Traditional Scheduling
- Risks And Common Mistakes To Avoid
- Comparing Visualization-Based Scheduling Alternatives
Key Takeaways
| Point | Details |
|---|---|
| Scheduling Visualization Enhances Planning | Visualization tools simplify complex scheduling processes by graphically representing time availability and constraints, enabling quicker decision-making. |
| Dynamic Tools Improve Coordination | Tools like interactive Gantt charts and network diagram schedulers provide dynamic elements that help planners adapt schedules in real-time. |
| Inverse Scheduling Offers Flexibility | Inverse scheduling methodologies prioritize participant availability, allowing schedules to adapt based on pre-set constraints rather than rigid timelines. |
| Risk Management is Crucial | Identifying potential scheduling pitfalls and implementing mitigation strategies can significantly improve the overall success of event planning. |
Defining Scheduling Visualization and Its Value
Scheduling visualization transforms complex event planning from a frustrating guessing game into a strategic, data-driven process. At its core, scheduling visualization is an innovative approach that graphically represents time availability, constraints, and potential scheduling windows across multiple participants or team members.
Traditional scheduling methods often involve endless email threads and manual calendar comparisons. In contrast, interactive scheduling visualization tools enable planners to quickly identify optimal meeting times by presenting availability data in intuitive, easy-to-understand visual formats. These tools highlight potential scheduling conflicts, resource limitations, and collaborative opportunities that might otherwise remain hidden.
Effective scheduling visualization goes beyond simple calendar displays. Modern techniques incorporate dynamic elements that show task interdependencies, resource allocation, and potential bottlenecks. By presenting scheduling information graphically, teams can make faster, more informed decisions about event planning, project timelines, and group coordination. The visual approach allows planners to quickly scan complex scheduling scenarios and identify the most promising time windows with minimal cognitive effort.
Pro tip: When using scheduling visualization tools, always input all known participant constraints upfront to maximize the accuracy of your scheduling recommendations.
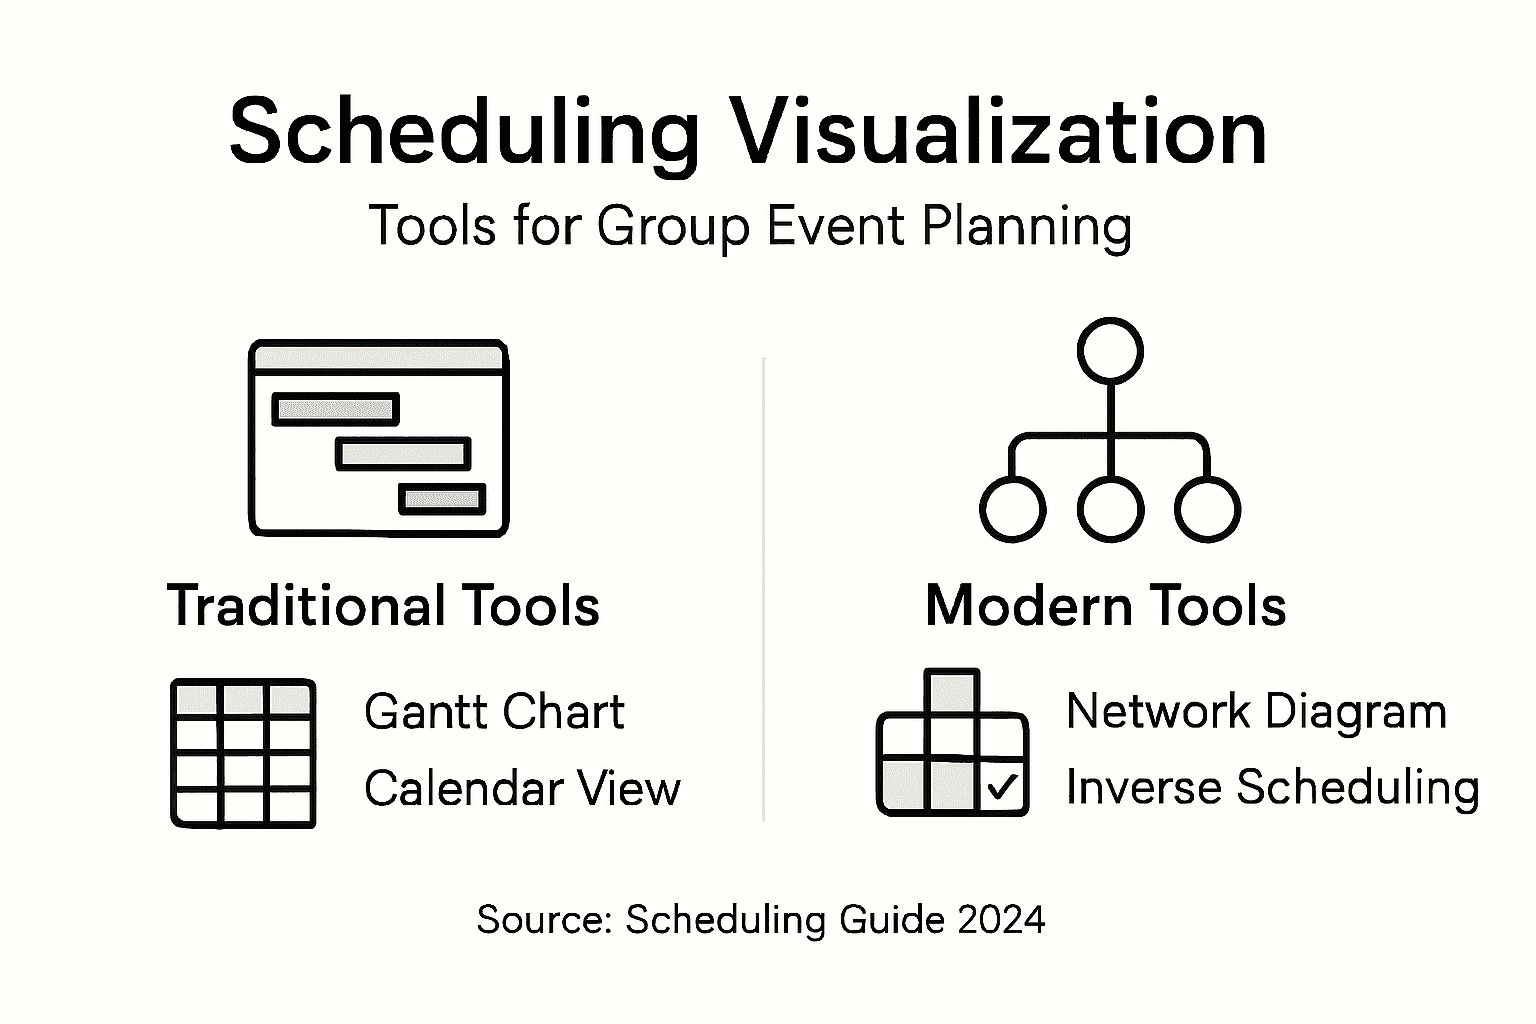
Variations of Scheduling Visualization Tools
Scheduling visualization tools have evolved dramatically, offering diverse approaches to represent complex time management challenges. Visual scheduling programs represent a significant advancement over traditional tabular methods, introducing interactive and dynamic ways of representing scheduling information.
These visualization tools typically fall into several distinct categories. Gantt charts remain the most recognizable, offering horizontal bar representations of tasks and timelines. More advanced versions like interactive Gantt tools incorporate dynamic elements such as drag-and-drop task modifications, color-coded resource allocation, and real-time conflict identification. Interactive visualization systems like iGantt and FlowOpt demonstrate sophisticated capabilities that enable users to not just view, but actively manipulate scheduling scenarios.
Other innovative variations include network diagram schedulers, which allow planners to create visual task interconnection maps, and timeline visualization tools that provide fluid, scrollable representations of complex multi-participant events. These tools leverage visual cognitive processing, enabling planners to quickly comprehend intricate scheduling scenarios that would be challenging to parse through text-based methods. Modern scheduling visualization approaches prioritize user interaction, allowing instant modifications and scenario testing that traditional scheduling methods cannot support.
Pro tip: Select scheduling visualization tools that offer multiple view modes, allowing you to switch between detailed and overview perspectives for maximum planning flexibility.
How Visualization Streamlines Multi-Day Planning
Multi-day event planning presents complex challenges that traditional scheduling methods struggle to address. Visualization techniques dramatically improve decision-making by transforming intricate scheduling information into intuitive, easily comprehensible formats that reduce cognitive processing time and complexity.
Modern visualization tools break down multi-day planning into manageable visual components. They enable planners to simultaneously track multiple variables such as participant availability, resource allocation, activity dependencies, and potential scheduling conflicts. Data visualization strategies allow event coordinators to quickly identify optimal time windows, understand intricate scheduling patterns, and make rapid strategic adjustments that would be nearly impossible through spreadsheets or text-based scheduling approaches.
The power of visualization lies in its ability to reveal hidden scheduling insights. Color-coded timelines, interactive calendars, and dynamic network diagrams transform abstract scheduling data into actionable visual narratives. These tools help planners recognize subtle scheduling patterns, anticipate potential conflicts, and create more flexible, responsive event plans. By presenting complex scheduling information through intuitive graphical interfaces, visualization tools reduce planning stress and increase the likelihood of successful multi-day event coordination.
Pro tip: Use visualization tools that offer color-coding and layered views to quickly distinguish between different types of scheduling constraints and participant availability.
Key Features of Inverse vs. Traditional Scheduling
Scheduling methodologies fundamentally differ in their approach to managing time and resources. Inverse interval scheduling represents a revolutionary approach that flips traditional scheduling paradigms by adapting processes to predefined constraints, rather than attempting to optimize task sequences within existing parameters.
Traditional scheduling methods rely on manual inputs and rigid rule sets that often create unnecessary complexity. In contrast, AI-driven scheduling techniques introduce dynamic optimization capabilities that transform how teams coordinate events. These advanced approaches leverage machine learning to provide real-time adjustments, dramatically reducing the time and effort required to create complex multi-participant schedules. The core difference lies in flexibility: traditional methods force participants to conform to a predetermined schedule, while inverse scheduling allows the schedule to adapt to participants' existing constraints.

Key distinguishing features between inverse and traditional scheduling include adaptability, efficiency, and user experience. Inverse scheduling tools prioritize participant availability by first identifying unavailable time slots, thereby simplifying the coordination process. Traditional methods typically require extensive back-and-forth communication, whereas inverse scheduling platforms can quickly identify optimal meeting windows with minimal participant effort. This approach represents a fundamental shift from rigid, time-consuming scheduling processes to more intelligent, user-centric coordination strategies.
Here's a side-by-side look at how traditional and inverse scheduling strategies differ:
| Aspect | Traditional Scheduling | Inverse Scheduling |
|---|---|---|
| Approach | Fixed sequences, manual input | Flexible, adapts to constraints |
| Effort | Requires significant coordination | Minimizes participant involvement |
| Flexibility | Low, rigid timelines | High, dynamic adjustment |
| User Experience | Often time-consuming | Streamlined and user-centric |
| Conflict Resolution | Needs frequent updates | Quickly identifies optimal windows |
Pro tip: When choosing a scheduling approach, prioritize tools that offer inverse scheduling capabilities to minimize coordination complexity and maximize participant convenience.
Risks and Common Mistakes to Avoid
Group event scheduling involves numerous potential pitfalls that can derail even the most carefully planned gatherings. Scheduling mistakes create significant planning challenges that can compromise the entire event's success, making it critical to understand and proactively address potential risks.
Some of the most frequent scheduling errors include creating dangling activities that produce unreliable dates, failing to establish clear predecessor-successor relationships, and ignoring critical scheduling conflict warnings. These mistakes can create cascading problems that undermine overall event coordination. Risk management techniques recommend implementing systematic approaches that identify potential disruptions before they impact the scheduling process. Advanced planners utilize sophisticated tools that help assess the likelihood and potential impact of scheduling conflicts, enabling proactive mitigation strategies.
Effective scheduling requires a holistic approach that goes beyond simple date tracking. Event planners must consider multiple variables, including participant availability, resource constraints, and potential external uncertainties. This means developing flexible scheduling frameworks that can adapt to unexpected changes, maintaining communication channels that allow rapid adjustments, and building contingency windows into the planning process. Understanding these nuanced challenges helps transform scheduling from a reactive task to a strategic planning opportunity.
This table summarizes common risks in event scheduling and how to address them:
| Risk Type | Example Impact | Mitigation Strategy |
|---|---|---|
| Dangling Activities | Unreliable event dates | Establish clear dependencies |
| Overlooked Conflicts | Unplanned overlaps | Use real-time conflict alerts |
| Resource Bottlenecks | Scheduling delays | Allocate backup resources |
| Communication Gaps | Missed updates | Maintain active feedback channels |
| Rigid Plans | Poor adaptability | Build contingency buffers |
Pro tip: Create a comprehensive scheduling risk matrix that documents potential conflicts, assigns probability ratings, and outlines specific mitigation strategies for each identified scheduling challenge.
Comparing Visualization-Based Scheduling Alternatives
Scheduling visualization represents a transformative approach to planning complex events, offering multiple alternative methodologies for capturing and managing time-sensitive information. Visual scheduling tools dramatically improve user performance by enabling more intuitive and interactive planning experiences compared to traditional tabular approaches.
The landscape of visualization-based scheduling encompasses several distinct paradigms. Network diagram schedulers allow planners to create intricate task interconnection maps, while interactive Gantt charts provide dynamic, color-coded representations of resource allocation and timeline management. Comparative scheduling paradigms reveal that visualization methods significantly outperform non-visual alternatives, particularly in complex project environments that require rapid adaptation and nuanced understanding of scheduling constraints.
Each visualization approach offers unique strengths. Mathematical modeling tools provide precise numerical representations, heuristic-based systems offer flexible decision-making frameworks, and machine learning-enhanced visualization platforms can predict potential scheduling conflicts before they emerge. The key differentiator among these alternatives lies in their ability to transform abstract scheduling data into comprehensible, actionable visual narratives that support strategic decision-making.
Pro tip: Evaluate scheduling visualization tools based on their ability to provide multiple view modes, real-time collaboration features, and intuitive conflict resolution capabilities.
Simplify Group Event Planning with Powerful Scheduling Visualization
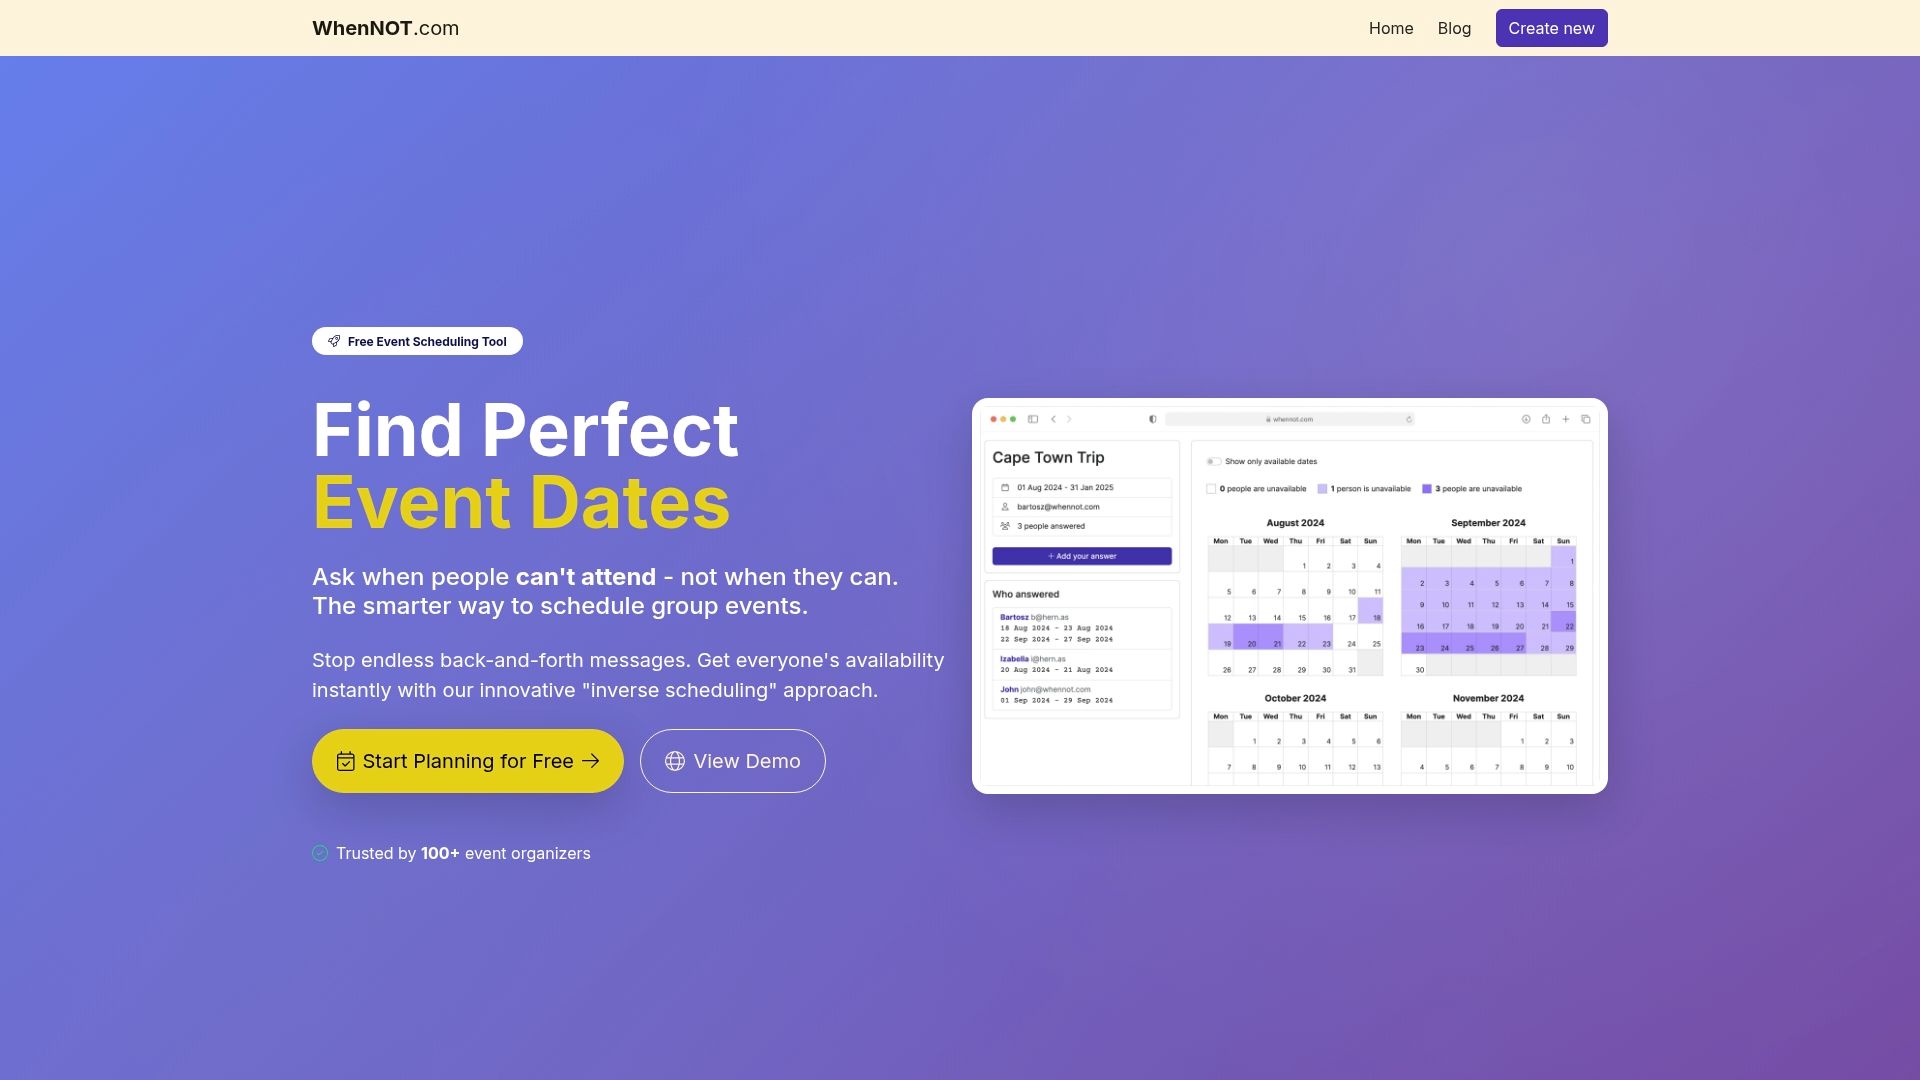
The article highlights the real challenge of coordinating group events, especially multi-day and flexible date gatherings, where traditional scheduling methods become overwhelming due to constant back-and-forth and unclear availability. Key pain points include managing participant availability transparently, avoiding scheduling conflicts, and minimizing effort spent on endless communication threads. Concepts like inverse scheduling and visual scheduling tools emphasize adaptability and participant convenience, making it easier to pinpoint optimal meeting windows with less hassle.
WhenNOT directly addresses these challenges through its innovative inverse scheduling approach that lets participants mark only when they are busy. This creates a clear visualization of everyone's unavailable days side-by-side, eliminating guesswork and saving precious planning time. Its no-login, privacy-focused design makes multi-day event planning stress-free for both organizers and attendees. If you want to stop wasting time on complicated scheduling workflows and enjoy a smooth, intuitive planning experience, explore what WhenNOT’s scheduling visualization can do for your group events.
Take control of your next group event now and experience planning made simple.
Visit WhenNOT today to create your first event and discover how effortless group scheduling can be when you focus on when participants are busy rather than free. Start saving time and avoid scheduling headaches with a tool designed for real-world group coordination needs.
Frequently Asked Questions
What is scheduling visualization?
Scheduling visualization is an approach that graphically represents time availability, constraints, and potential scheduling windows, transforming event planning into a strategic, data-driven process.
How do visualization tools improve group event planning?
Visualization tools present complex scheduling data in intuitive formats, allowing planners to identify conflicts and resource limitations quickly, thus enabling faster, more informed decision-making.
What are the different types of scheduling visualization tools available?
There are several types of scheduling visualization tools, including Gantt charts, network diagram schedulers, and interactive timeline tools, each offering unique features to help manage complex scheduling tasks.
What are common mistakes to avoid in scheduling?
Common mistakes include overlooking scheduling conflicts, creating dangling activities, and failing to establish clear task dependencies. Implementing systematic approaches can help mitigate these risks.